




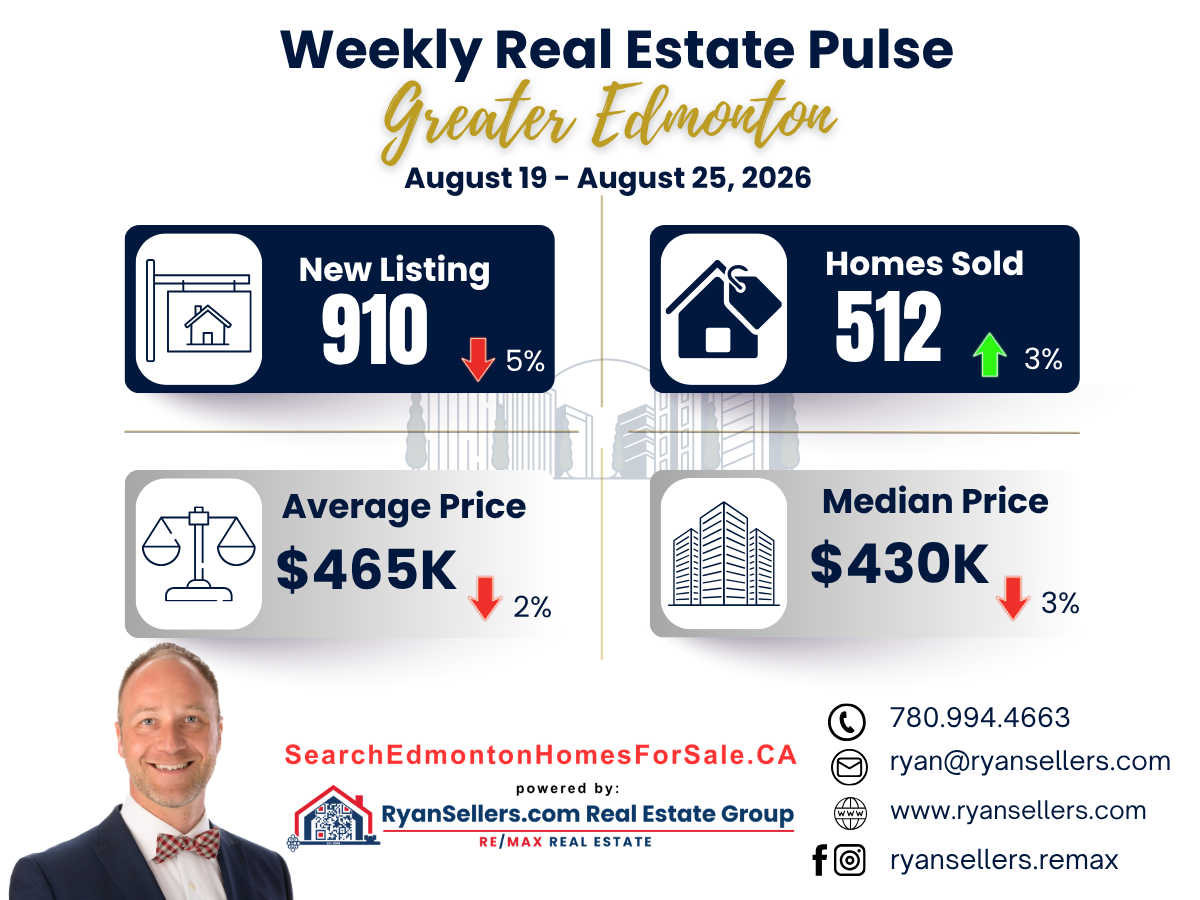
The Greater Edmonton Area real estate market saw a mix of changes during the week of August 19–25, 2026. Unit sales increased compared with the previous period, while new listings and both average and median prices moved lower.
Here is a closer look at the latest weekly market numbers and what they show about current activity across the Greater Edmonton Area.
More Homes Sold This Week
A total of 512 residential units were sold, representing a 3% increase from the previous period.
The increase in sales indicates continued buyer activity across the Greater Edmonton Area. While weekly numbers can shift from one period to another, sales activity remains an important indicator of how actively buyers are participating in the market.
New Listings Declined 5%
The market recorded 910 new listings, down 5% from the previous period.
With fewer new properties coming onto the market this week, buyers had fewer newly listed homes to choose from. For sellers, understanding the level of new competition in their specific neighbourhood and property type remains important when determining pricing and marketing strategies.
Average Price Was $465,000
The average residential price was $465,000, a 4% decrease from the previous period.
Average price can be influenced by the mix of properties sold during a particular week, so it is best viewed alongside other market indicators rather than on its own.
Median Price Was $430,000
The median residential price was $430,000, down 3%.
The median price represents the midpoint of the homes sold during the period, with half selling above that figure and half selling below it. Looking at both average and median prices provides additional context when reviewing weekly market activity.
Greater Edmonton Market Snapshot
For August 19–25, 2026:
- New Listings: 910 | ↓ 5%
- Unit Sales: 512 | ↑ 3%
- Average Price: $465,000 | ↓ 4%
- Median Price: $430,000 | ↓ 3%
What This Means for Buyers and Sellers
This week's numbers show a market where sales activity increased while new listings and prices moved lower. However, weekly market statistics provide only a snapshot, and conditions can vary significantly depending on the neighbourhood, property type, price range, and individual circumstances.
For buyers, current conditions may create opportunities to explore available properties while paying close attention to pricing and competition. Sellers should focus on accurate pricing, strong presentation, and a marketing strategy that helps their property stand out among the available inventory.
Whether you're considering buying, selling, or simply keeping an eye on Edmonton real estate, tracking market trends can help you make more informed decisions.
Market data: According to the REALTORS® Association of Edmonton's MLS® System. Total Residential includes Detached, Semi-detached, Row/Townhouse, and Apartment Condominium properties.
Want to know what these numbers mean for your specific Edmonton-area neighbourhood? Connect with Ryan Sellers Real Estate Group for a more personalized look at the market.
Check out this article next